Introducing Jaal - Interacting with Network Made Easy!
![]()
Your interactive network visualizing dashboard in Python
Visit the package’s github page , and if you like it, please don’t shy from clicking on the star 😏
—
👉 What is Jaal?
Jaal is a python based interactive network visualizing tool built using Dash and Visdcc. As it’s built using Dash, we can consider it as more of a dashboard rather than a network plot. Because of this, along with the basic features, Jaal also provides multiple options to play with the network data such as searching, filtering and even colouring nodes and edges in the graph. And all of this within 2 lines of codes :)
👉 Install
Installing Jaal is super easy, just run the following,
pip install jaal
And you are done 😆
Note, it’s recommended to create a virtual environment before installing. This can be easily done using python -m venv myenv and then to activate the environment we run,
(Windows)
.\\myvenv\\Scripts\\activate.bat(Linux)
source myvenv/bin/activate
👉 Getting started
After installing Jaal, we need to fetch the data and call plot function in Jaal. Let’s do this by playing with Game of Thrones dataset which is included in the package. The complete code to fetch the data and plot is as follows,
# import
from jaal import Jaal
from jaal.datasets import load_got
# load the data
edge_df, node_df = load_got()
# init Jaal and run server
Jaal(edge_df, node_df).plot()
Here first we import Jaal main class and the dataset loading function load_got. Later we loaded the GoT dataset from the package. This gives us two files,
edge_df: it’s a pandas dataframe with at least from and to columns, which represents the edge relationship between the entities
node_df: it’s a pandas dataframe with at least id column which contains the unique node names
Note, edge_df is mandatory and node_df is optional. Also, we can include additional columns in these files which are automatically considered as edge or node features respectively.
Next, we pass the data into Jaal and call plot. This will lead the console to prompt the default localhost address (127:0.0.1:8050) where Jaal is running. We can access it to see the following dashboard,
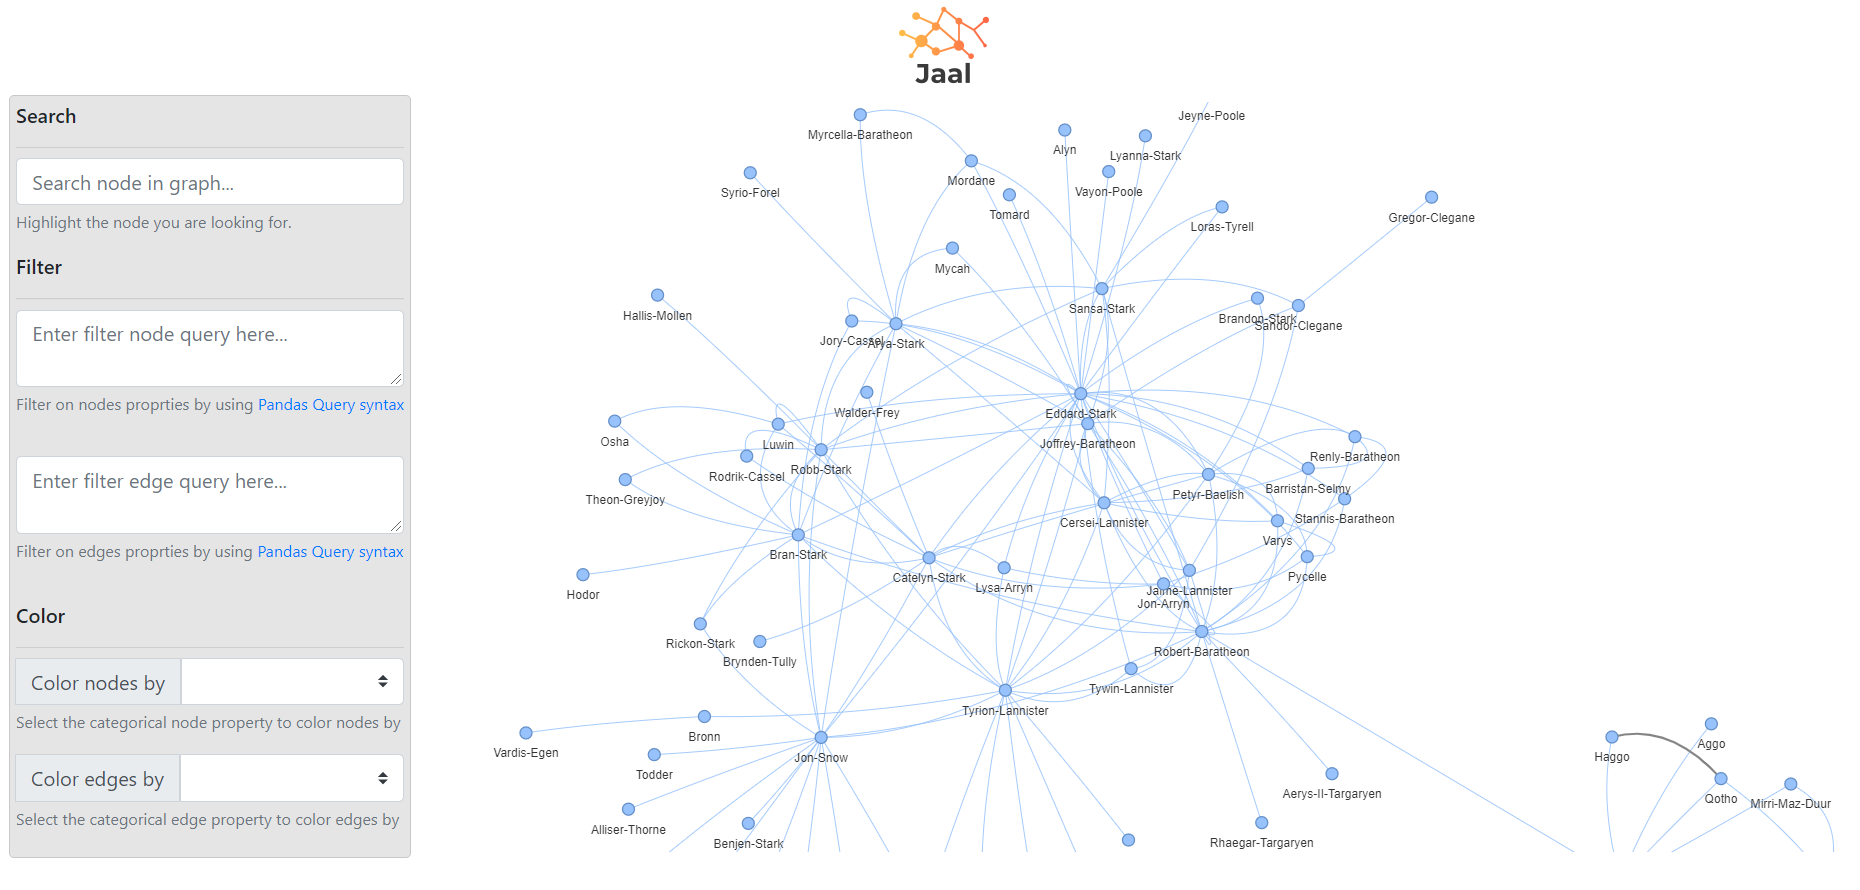
Jaal Dashboard
👉 Features
At present, the dashboard consist of the following sections,
Settings panel: here we have multiple options to play with the graph data. It further contains the following sub-sections,
Search: can be used to highlight a node in the graph
Filter: supports pandas query language and can be used to filter the graph data based on nodes or edge features.
Color: can be used to color nodes or edges based on their categorical features. Note, currently only features with at max 20 cardinality are supported.
Graph: the network graph plotted using visdcc.
👉 Examples
Let’s go through the example of each of the features we discussed above one by one. We will use the GoT dataset.
Searching
The first option is searching, where we can search for a specific node in the graph. It supports character by character search on the node labels. Below is an example where we are trying to search for “Arya”,
Filtering
Next, we have filtering. Jaal supports the option to search on both node and edges features. For this, we provide separate text areas. Below we can see the live effect of node and edge filtering query.
Coloring
Finally, instead of filtering, we may want to see the overall distribution of any feature. Currently, Jaal handles this by providing the option to color nodes or edges based on any categorical feature. We can see a live-action example below.
—
Connect with me on LinkedIn .
—
Contents:
