Introduction to Processing with Bezier curves
A intuitive hands-on session on a visual arts sketchbook software by drawing the curves that puts life into animations!
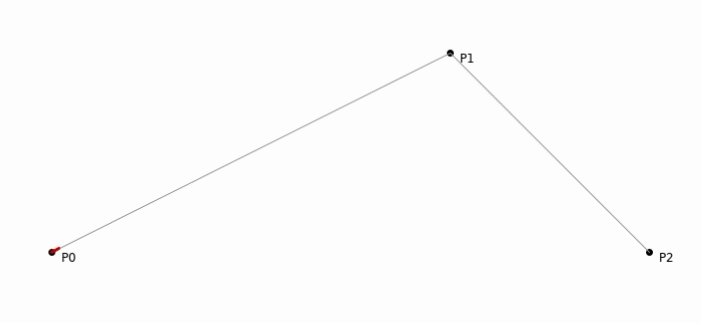 Quadratic Bezier curve in all its glory!
Introduction
In this post, we are are going to learn the basics of processing — its an interactive visual software and language used by students and artists around the global. Its open source, has OpenGL integration and supports multiple languages (Java, JS, Python, etc) & OS (Mac, Windows, Linux, Android, etc). On the other hand, Bezier curves are the building blocks in basically anything that has to do with curves in computer graphics and is used even in animations. I picked this example as this post will introduce us to an important mathematical topic in fields of polyline and with visualization we will also learn some basics of processing. Let’s get started!
Bezier Curves — Why and How?
In a 2D plane, suppose you want to draw a line. Its quite easy, all you need is two points and you connect them with the shortest path possible — which is the straight line. Now what if you want to draw a curve. Then you need to answer some questions — Whats the angle of curve? How many such curves or twists and turns are there? It gets quite complicated quickly. Enter Bezier curves. The intuition is placement of anchor points — fixed points between which the curve is to be drawn, and control points — points used to give curviness to the original line. Now the count of these points defines the order of the curves. The most famous being linear (2 anchor), quadratic (1 control and 2 anchor) and cubic curves (2 control and 2 anchor).
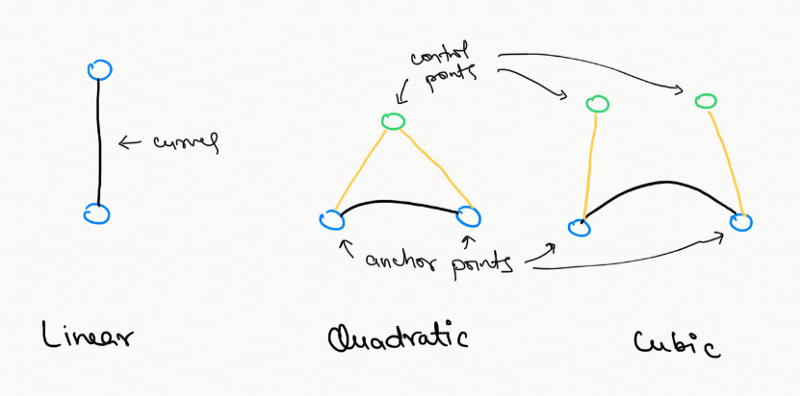 Some basic types of bezier curves.Now based on the position of the control point, we can change the shape of the curve. If the control point is close to an anchor point, the curve has larger angle for that point w.r.t. to the other anchor point. That said, we need to find the formulae which, given the position of these points, will give us the co-ordinates of the curves. To keep things simple, let’s stick with the quadratic curve. Hence, all we know are three points, say P0 (AP), P1 (CP) and P2 (AP). Without going into detailed math, the formulae for a quadratic curve is given by,
 Quadratic Bezier curve. Source: here.Here,
- B(t) gives the co-ordinate of the curve at step ‘t’
- P0, P1 and P2 are the anchor and control points.
- ‘t’ **defines the steps. It is bounded between 0 and 1. At **t =0, B(t) gives P0 **and at **t = 1, B(t) gives P2. With this, we are ready to dive into the world of Processing and start drawing this thing up!
Processing
Processing supports coding in multiple languages, I will tryout the python version. You get can download and install it from here, let me know in case of any issue. Before we get started, lets go through some basics of processing,
- There is a setup area, which is called first and used to configure the environment. In processing this comes under setup function.
- There is a draw area. This is called iteratively as per the frame rate. This is where we do major plotting. In processing this comes under draw function. Let us define the setup function first, it goes as;
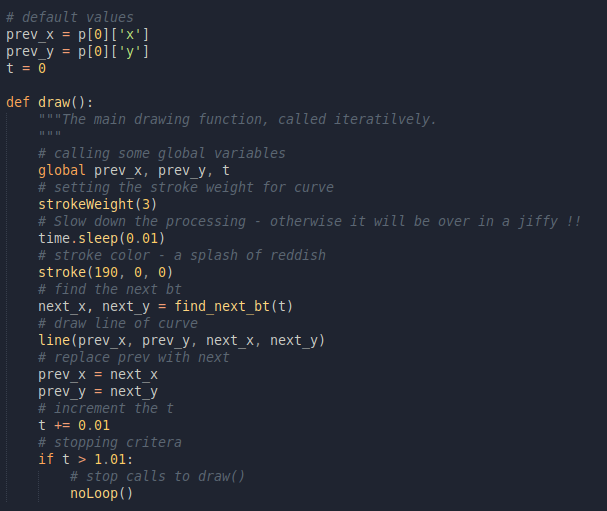
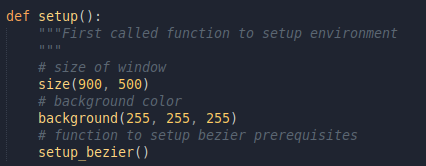 Setup the environmentThe function contains;
- size which defines the size of window or canvas. All drawing will happen within this window.
- background which defines the background color. We have selected white. We have also created another function, called setup_bezier which plots the AP and CP along with drawing lines between them.
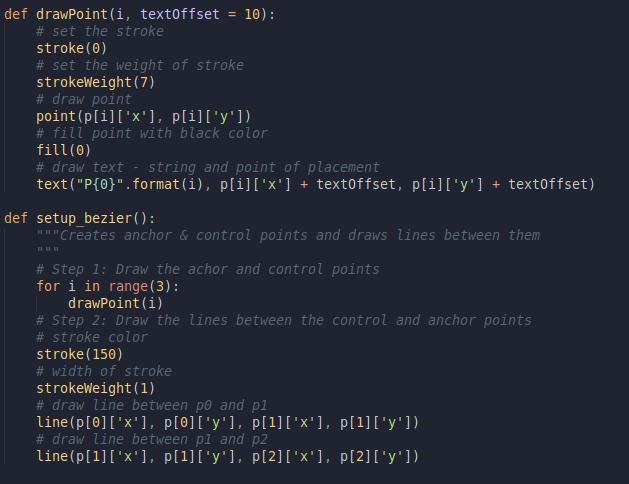 Some pre-plottings!Now this is quite a lot, lets understand the code,
- setup_bezier performs two tasks, (1) draw the P0, P1 and P2 points. For this it calls another function drawPointand, (2) it draws line between the pair (P0, P1) and (P1, P2)
- stroke is used to set the color of outline of the next object we draw. If the input to this is a single parameter, it considers greyscale and if there are 3 parameters, it uses RGB formatting.
- strokeWeight defines the size in pixel of the stroke.
- point takes two values as input and draws a point on that x and y co-ordinates.
- fill is used to fill in an object with some color. Follows the same logic of input as stroke .
- text takes 3 inputs — string to display and the x, y co-ordinates of its position.
- line takes 4 inputs, x-y co-ordinates of two points between which a straight line is to be drawn.
- Let’s assume we have a global dictionary called p which stores the values of three points. It will store it like this,
 P0, P1 and P2 stored in a variable.Now before the drawing part, lets also convert the Bezier formulae into working python code.
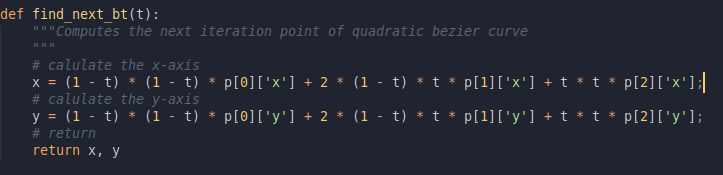 Repeats the formulae for z and y coordinate calculationNow we are ready to start with the main drawing function. Our logic will be to iterate over t **and find out the points of the curve i.e. B(t). Now if we iterate with say 100 steps i.e. **t **goes from 0 to 1 in steps of 0.01, we will get around 100 values of B(t). Keeping things simple, all we need to do is to draw a straight line between the last and next **B(t) point. Lets get started,
 The main drawing function!Lets understand the code here,
- We defined prev_x and prev_y to store the previous value of** B(t), which at start was **P0.
- We defined t and set it as 0. We will use this to iterate over per step.
- At start of draw function, we define global as we want to use and update the mentioned global variables.
- find_next_bt takes t as input the compute the B(t) for that step.
- line draws a straight line between the previous and newer** B(t).**
- At the end, we increment the value of t
- We use time.sleep so as to visualize the drawing slowly.
- Finally, we added a stopping condition, to break with noLoop when we have reached the P2. The complete code is,
Here, remember the main entities are the three points. By changing their values and re-drawing we get different instances of the curves. Let’s try out a few variations to get a feel of it.
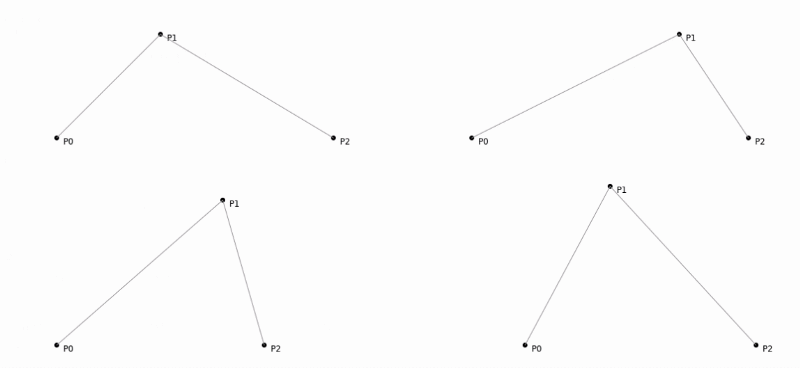 Different variations — changing the anchor and control points.#### Conclusion
The example was chosen to provide a basic intro to processing. Think of this as a next level hello world program for processing. Because we wanted to cover multiple basic operations, we may have taken long cut for few approaches, but that said, it was done to keep the intro a little advanced without touching the real complex pieces. One example, processing provides a built in function to plot bezier curve, which just requires the points and performs the calculations within. But whats the fun in that :)
References
[1] Processing
[2] Bezier curves — Wikipedia
For more posts like this visit my personal site **here*.*
Cheers.