Classification
Note
This page is still not complete and new sections might get added later. That said, the existing content is ready to be consumed. 🍔
Introduction
Classification is a fundamental task in supervised machine learning, where the goal is to assign predefined labels or categories to input data points based on their features. Unlike clustering, which deals with unsupervised learning and aims to discover inherent patterns or groupings in data, classification relies on a labeled dataset to learn a model that can make predictions on new, unseen data. The primary objective of classification is to create a decision boundary or model that can accurately differentiate between different classes or categories within the data. Some use cases of classification could be bank loan defaulter prediction, spam email detection, image recognition, medical diagnosis, sentiment analysis, etc.
Metrics
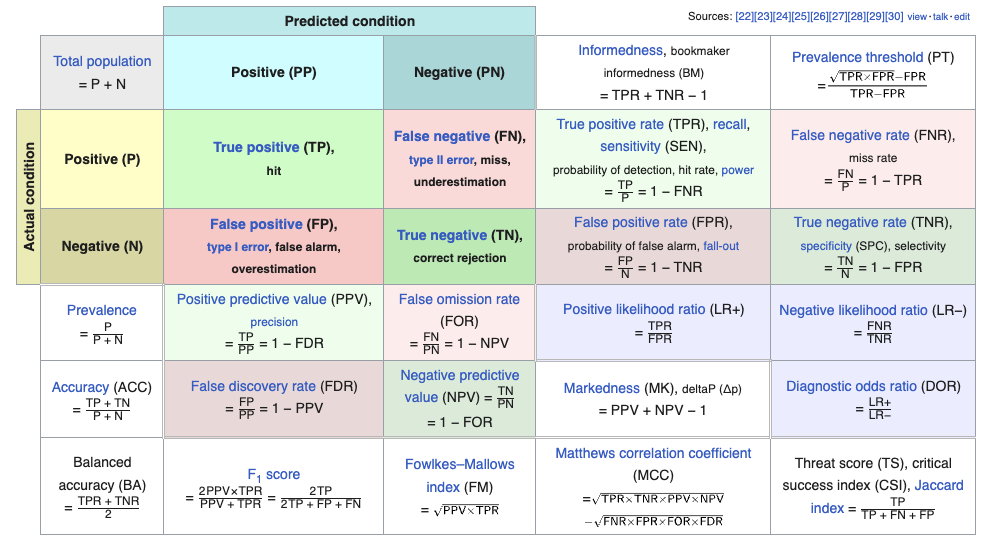
Classification metrics are used to evaluate the performance of a classification model by comparing its predictions to the actual ground truth labels. Here are some common classification metrics,
-
Accuracy: Accuracy is the most basic classification metric, measuring the ratio of correctly predicted instances to the total number of instances. It provides an overall measure of the model's correctness. However, it may not be suitable for imbalanced datasets, where one class significantly outnumbers the others.
\[{\displaystyle \mathrm {Accuracy} ={\frac {TP+TN}{TP+TN+FP+FN}}}\] -
Precision: Precision is the ratio of true positive predictions to the total number of positive predictions made by the model. High precision indicates that when the model predicts a positive class, it is likely to be correct.
\[{\displaystyle \mathrm {Precision} ={\frac {TP}{TP+FP}}}\] -
Recall (Sensitivity or True Positive Rate): Recall is the ratio of true positive predictions to the total number of actual positive instances in the dataset. It measures the model's ability to capture all positive instances. High recall means that the model can find most of the positive cases.
\[{\displaystyle \mathrm {Recall} ={\frac {TP}{TP+FN}}}\] -
F1-Score: The F1-Score is the harmonic mean of precision and recall. It balances both metrics and is particularly useful when you need to consider the trade-off between precision and recall. It's a good overall measure of a model's performance.
Note
Please be aware of
averageparams in the Sklearn implementation. Set the param tomacroin case of imbalanced dataset, as it will compute the score for each class and then perform unweighted average i.e. giving each class equal importance, no matter their frequency. Setting it toweightedis similar tomacro, but now the average will be weighted. Setting tomicrowill lead to computing the numbers for complete data without considering any class.\[{\displaystyle \mathrm {F1}_{score} ={\frac {2}{\frac {1}{\mathrm {Precision}}+\frac {1}{\mathrm {Recall}}}}}\] -
Specificity (True Negative Rate): Specificity measures the model's ability to correctly identify negative instances. It is the ratio of true negative predictions to the total number of actual negative instances. It is particularly relevant when false negatives are costly.
\[{\displaystyle \mathrm {Specificity} ={\frac {TN}{TN+FP}}}\] -
ROC Curve and AUC: The Receiver Operating Characteristic (ROC) curve is a graphical representation of the model's performance across different thresholds. The Area Under the ROC Curve (AUC) quantifies the overall performance of the model, with a higher AUC indicating better discrimination between classes.
-
Confusion Matrix: A confusion matrix is a table that summarizes the model's predictions compared to the actual labels, breaking down true positives, true negatives, false positives, and false negatives. It provides detailed insights into the model's performance.
The choice of which metric to use depends on the specific problem, the nature of the dataset, and the business or application requirements. It's essential to consider the context and goals when selecting the appropriate classification metrics for evaluating a machine learning model.
Classification Algorithms
While there are many classification algorithms, here are some of the most common and widely used ones,
Logistic Regression
- Logistic Regression is a widely used classification model that is particularly effective for binary classification problems. It works by modeling the relationship between the input features and the probability of belonging to a particular class. It does this by fitting a logistic curve to the data, which allows it to output probabilities that an instance belongs to a specific class. Logistic Regression is a linear model, which means it assumes a linear relationship between the input features and the log-odds of the class probabilities. It's simple, interpretable, and computationally efficient, making it a good choice for problems with a large number of features.
-
The formula for Logistic Regression is shown below,
\[{\displaystyle \mathrm {LogisticRegression_loss}(i) = -(y_i \log(\hat{y_i})+(1-y_i) \log(1-\hat{y_i}))}\]where, \(y_i\) is the actual class and \(\hat{y_i}\) is the predicted class
Decision Tree
- A Decision Tree is a versatile and interpretable machine learning model used for both classification and regression tasks. It is a tree-like structure where each internal node represents a feature, each branch represents a decision rule based on that feature, and each leaf node represents the predicted outcome or value. Decision Trees are particularly well-suited for tasks where the decision-making process can be represented as a series of logical if-then-else conditions.
- One of the significant advantages of Decision Trees is their transparency and interpretability. The model's decision rules can be easily visualized, understood, and explained to non-technical stakeholders, making it a valuable tool in domains where interpretability is crucial, such as healthcare and finance. However, Decision Trees can be prone to overfitting, especially when they are deep and the dataset is small. To mitigate this issue, techniques like pruning, limiting tree depth, and using ensemble methods like Random Forests or Gradient Boosting Trees are often employed. Decision Trees also provide feature importance scores, helping analysts identify the most critical factors driving the model's predictions, which can inform feature selection and data exploration efforts in a broader context.